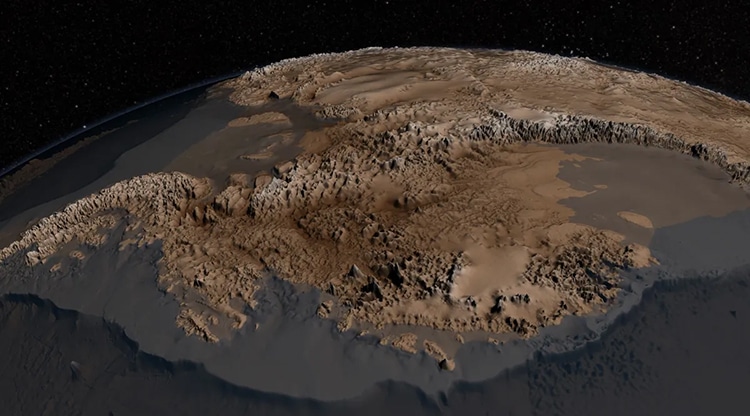
The Bedmap2 topography beneath Antarctic ice. (Photo: NASA/Goddard Space Flight Center)
The ice caps are melting. Sea levels will rise. Climate change is reshaping the Earth. But what would an iceless world look like? NASA has an idea. In 2013, NASA created Bedmap2, a detailed topographical model—or suite of gridded products—showing the bedrock landscape underneath icy Antarctica, as well as sea elevation. Through radar technology and detailed data collection of 25 million measurements, Bedmap2 provides insight into a changing world.
The original Bedmap was created in 2001. Bedmap2 uses a lot more data to create a compilation of knowledge surrounding the Antarctic region south of 60 degrees south. Surface elevation, ice thickness, and bedrock topography data from NASA and the British Antarctic Survey help paint a detailed picture of a hidden world. While Antarctica is 98% covered by ice, underneath is a range of rock mountains and gorges. Using radar technology, known as Multichannel Coherent Radar Depth Sounder, researchers discovered the lowest point on the continent: 9,416 feet below sea level under Byrd Glacier.
“Ice sheets grow because of snow, and like honey poured on a plate, spread outward and thin due to their own weight,” Sophie Nowicki, of NASA's Goddard Space Flight Center said in a statement. “The shape of the bed is the most important unknown, and affect how ice can flow. You can influence how honey spreads on your plate, by simply varying how you hold your plate.”
The shape of the rock bed is particularly important for calculating how climate change will impact Antarctica and the world. 6.4 million cubic miles of ice could create a 190-foot sea-level rise. In fact, sea levels are already rising at a worrying rate. Researchers are already at work on Bedmap3 to help further understand our coldest continent in a changing world.
NASA's Bedmap2 depicts the rock bed beneath Antarctica and helps scientists understand how melting ice would flow toward the sea.
The Bedmap2 data also describes what we can expect from sea level rises.
h/t: [IFL Science]
Related Articles:
Art History: Ancient Practice of Textile Art and How It Continues to Reinvent Itself
Sister Duo Weaves Textured Wall Hangings Inspired by Australian Landscapes
How to Crochet: Learn the Basics of This Time Honored Handicraft
Artist Fills Forest with Life-Size Sculptures Made from Woven Rods of Willow